Coal Market Report - a User Guide
This short guide to the Coal Market Report will help you make the most of your subscription.
Click on the headings below to learn more about what's covered in each section of the report.
Daily Thermal & Metallurgical Coal Indices
Daily Thermal Coal Indices
| Products | Week TD | Daily % Ch | Month TD | Daily % Change | Best Qualifying Index Bid | Best Qualifying Index Offer |
|---|---|---|---|---|---|---|
| NEWC | $134.02 | 0.22% | $133.01 | 0.11% | $136.00 | $133.50 |
| Des ARA | $113.50 | 0.00% | $113.50 | 0.00% | $110.00 | $110.00 |
| RB | $103.17 | - 2.44% | $108.59 | - 1.17% | $97.00 | $99.00 |
globalCOAL indices provide reference prices for the three most liquid thermal coal trading hubs of NEWC, DES ARA and RB. The Indices are compiled according to a transparent methodology which combines bids / offers and transactions made via the globalCOAL platform.
The NEWC Index represents the spot price for Physical NEWC spec coal delivered at Newcastle port in Australia under SCoTA T&Cs.
The RB Index represents the spot price for Physical RB1 spec coal delivered FOB at RBCT, Richards Bay, South Africa under SCoTA T&Cs.
The DES ARA Index represents the spot price for Physical ARA spec coal delivered at the ports of Amsterdam, Rotterdam or Antwerp in Northern Europe under SCoTA T&Cs.
Week TD (to date) shows the weekly index as it stands on that day.
Month TD (to date) shows the monthly index as it stands on that day.
The weekly index is published every Friday, while the monthly index is published on the last Friday of the index month1.
Daily % Ch is the daily rate of change, either positive or negative, to the relevant indices.
Best Qualifying Index Bid / Offer indicate the highest bids and the lowest offers qualifying for inclusion in the index calculation on that day.
1 Index Month is defined in the globalCOAL index methodologies as 'the period for which the monthly index is calculated. It begins the first business day following the close of the prior calendar month and terminates on the last Friday of the calendar month'.
Market Overview - Updates from the thermal and met coal desks
globalCOAL brokers in London and Singapore share their perspective on the day's trading. They cover significant price moves as well as market influencers across the thermal and met coal markets.
The London update focuses on activity in the hubs of NEWC, RB & ARA, while the Asian desk also includes a flavour of the High Ash Aus 5500 and INDO 3800 markets and our met coal desk covers movements in the coking coal space.
globalCOAL Thermal and Metallurgical Trades this week
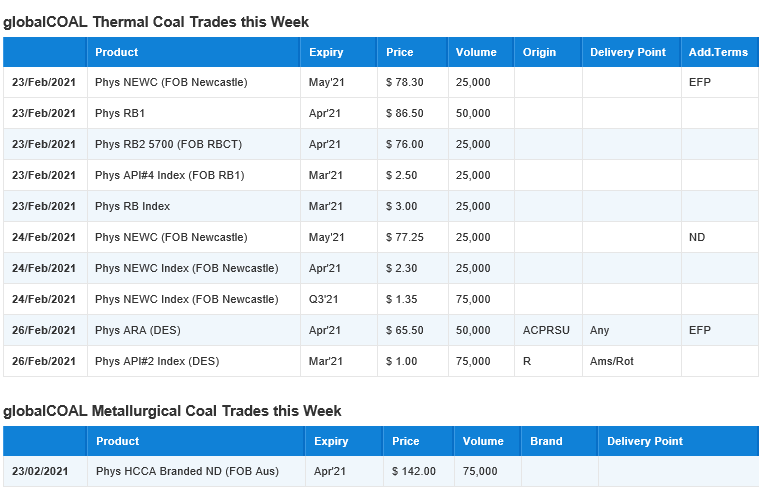
Product:
The instrument which has traded
Expiry:
The delivery period
Price:
The price at which it transacted (US$)
Volume:
The total volume traded in one transaction - measured in metric tonnes
Origin:
DES ARA may originate from any of the following: Australia, Colombia, Poland, Russia, South Africa or USA. If origins are restricted, it is listed here
Delivery point:
The DES ARA instrument is delivered ex-ship at one of Amsterdam, Rotterdam or Antwerp ports. If parties to the trade had agreed to restrict the delivery points, eg, to only deliver the cargo to Rotterdam, it is highlighted here.
Add. Terms:
Additional terms such as Exchange of Futures for Physical (EFP) or Non Divisible (ND) may be entered here
EFP: Is a credit efficient tool to transact physical coal on a fixed price basis
ND: Means that it is not possible to deliver the cargo on to more than one vessel
Recent Coal Indices
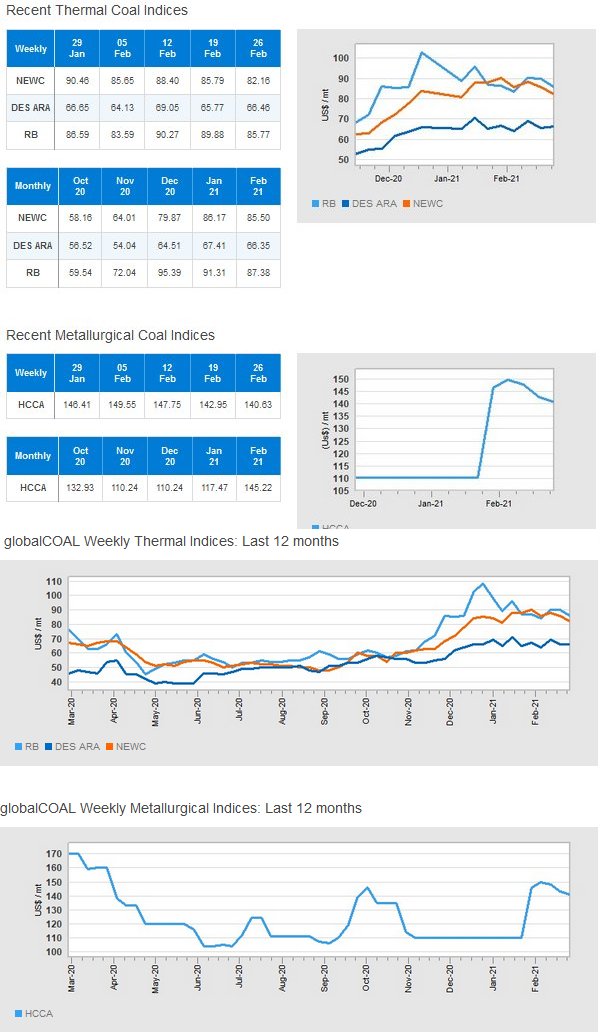
This section contains a look-back at the most recent weekly and monthly indices for NEWC, DES ARA & RB as well as for the metallurgical coal index HCCA.
The Weekly Index is published every Friday while the Monthly Index is published on the last Friday of the Index Month.
If you're conducting analysis on historical price movements, you can also download all historical indices.
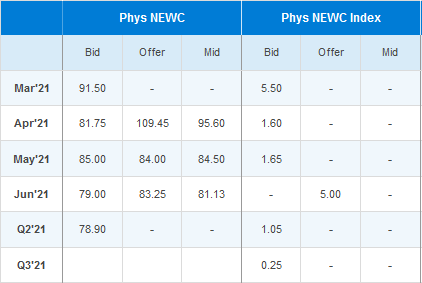
Coal Forward Prices
Coal Forward Prices represent the prices at which the market is willing to transact future business, today. The tables show the best bids and offers seen on the globalCOAL platform between 00:00 (midnight) and 18:00 (6pm) local London time. 'Mid' represents the median price.
All periods for which bids and offers have been made that day will be populated with prices.
Occasionally bids and offers may display as inverted (ie bid prices are higher than the offers) or choice (ie there is a spread of zero between bid and offer prices). This is because prices are gathered throughout the day and there may be significant market movement intraday.
The first table displays forward fixed and index-linked prices for physical contracts in the NEWC (Newcastle, Australia) market::
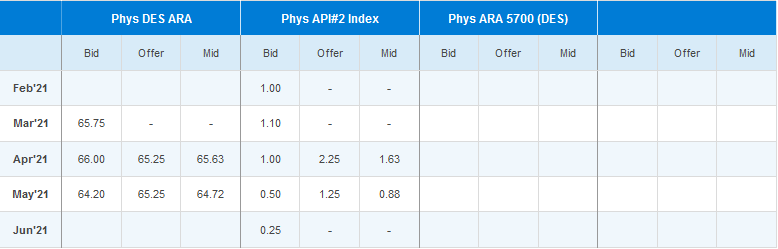
The second table displays forward fixed and index-linked prices for physical contracts delivered ARA (Amsterdam, Rotterdam, Antwerp in Europe):
The next 2 tables show bids and offers for fixed price and index-linked physical contracts for coals of various qualities, delivered FOB Richards Bay in South Africa:
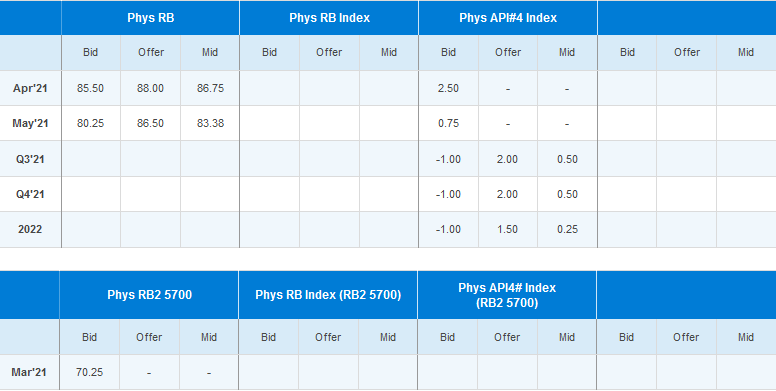
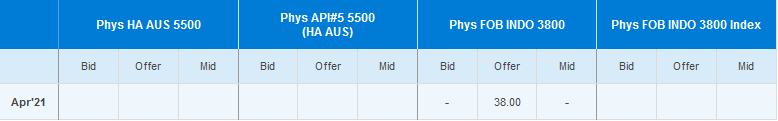
Table 5 contains forward prices for fixed and index-linked physical contracts in the High Ash Australian market and the FOB INDO 3800 market:
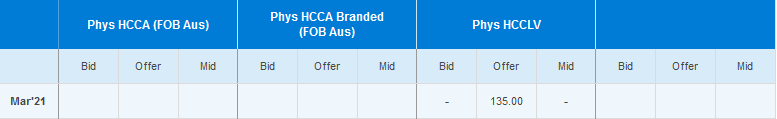
The final table represents bids and offers in the metallurgical coal market. You can view bids and offers for HCCA Branded and Unbranded (FOB Australia) and HCCLV physical contracts as well as for the low vol HCCLV product:
Closing Curves
The data shown in 'Physical Curve: Fixed Price & Index-Linked' represents an assessment by globalCOAL brokers of where value lies across the physical thermal and metallurgical coal trading hubs at the end of the London trading day.
The following factors are considered by the brokers compiling the curves:
- Trades completed
- Bids/offers posted to the globalCOAL screen
- When valuing the index curve in periods of limited liquidity, brokers look at the spread between the illiquid period and a period where value is clearer. Providing the time spread hasn't moved dramatically, they use this to frame value
- To compile fixed price curves in the absence of bids and offers, brokers use an aggregated paper value. They apply the appropriate premium/discount (from the index curve) to the paper/swap value (obtained from multiple sources) to create a fixed price value
The gC NEWC Futures Curve is an indicative price assessment for the ICE gC Newcastle Coal Futures market.
Freight Forward Prices
This table displays the best bids, offers and corresponding mid-points for freight forward prices on 3 major shipping routes: Richards Bay to Rotterdam, Bolivar to Rotterdam and the C5 route (Western Australia to Qingdao, China).
Source: SSY (Capesize Coal FFA Market Prices)
Friday's Report - Additional Material
The last report of the week contains the following additional information:
- A graph charting price movement for the NEWC, DES ARA & RB Indices over the last 12 months
- Prices of other related energy markets such as oil and gas
- A UK Clean Power Spread Prices graph charting UK Clean Dark Spread (i.e. the difference between the output market price of electricity, minus the cost of buying and converting coal into electricity and the cost of purchasing carbon certificates) against the UK Clean Spark Spread (ie the difference between the output market price of electricity, minus the cost of buying and converting gas into electricity and the cost of purchasing carbon certificates)
- A graph charting ICE Futures Oil and Gas Daily Settlement Prices for the prompt month
- Share prices for a number of energy and mining listed companies, as well as currency exchange rates